Graph & Spectrogram Reading
Learn how to read charts, spikes, whiteouts, and spectrogram structure without mistaking noise for a real signal.
Search-intent clusters built for live discovery
You are inside the Graph & Spectrogram Reading cluster. Every article below reinforces the same search intent and internal link path.
Graph & Spectrogram Reading
Learn how to read charts, spikes, whiteouts, and spectrogram structure without mistaking noise for a real signal.
Current cluster 1 articlesScience, Measurement & Myths
Keep source checking, NASA myths, station limits, and measurement methodology in a verification-first cluster.
Open cluster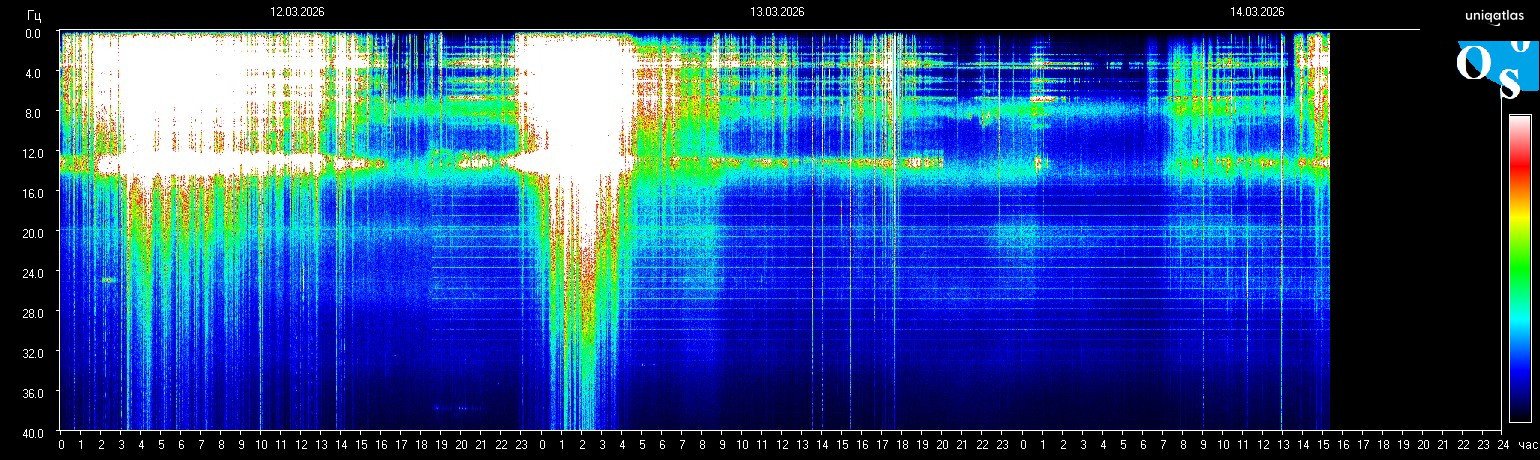
Is Schumann Resonance Dangerous? What Live Data Can and Cannot Tell You
A careful explainer for dangerous or harmful Schumann resonance searches, showing where live environmental monitoring ends and unsupported certainty begins.
Read More → What Can Raise Schumann Resonance Charts? Storms, Noise, Compression, and Station Limits
A practical guide to what can raise Schumann resonance charts, separating environmental drivers from noise, compression artifacts, and station-side limits.
Read More → Schumann Resonance Spike Meaning: How to Verify a Real Spike vs Chart Saturation
A verification-first guide to Schumann resonance spike meaning, focused on saturation, clipping, bright blocks, and how to avoid overreading one dramatic frame.
Read More → Schumann Resonance 7.83 Hz Today: What Is Normal Drift and What Is Not?
A clear guide to 7.83 Hz today searches, explaining baseline drift, why one decimal move is not always a major event, and how to compare today with the wider live picture.
Read More → Schumann Resonance Today: How to Read the Fresh Frame Before You Share It
A fresh reading guide for Schumann resonance today searches, focused on the newest frame, timing, color pressure, and what to verify before calling the chart unusual.
Read More → Schumann Resonance Chart Colors Meaning: How to Read Blue, Green, Yellow, Red, and White
A focused guide to Schumann resonance chart colors, what calm and bright zones usually indicate, why white can mean saturation, and how station palettes affect interpretation.
Read More → Schumann Resonance and Alpha Waves: Why 7.83 Hz Appears in Brainwave Discussions
A practical explanation of why Schumann resonance is often linked with alpha waves, what that overlap actually means, and what it still does not prove about the human brain.
Read More → Schumann Resonance and Solar Flares: What Space Weather Can Actually Influence
A practical explanation of how solar flares and broader space-weather conditions can influence Schumann resonance monitoring, and what they still do not prove on their own.
Read More → Schumann Resonance Spiritual Meaning: How to Read Interpretations Without Losing Real Context
A balanced guide to Schumann resonance spiritual meaning searches, why people connect live charts with awakening language, and how to keep symbolic interpretation separate from measured data.
Read More → Schumann Resonance Symptoms: What People Report and What the Data Can Actually Support
A careful guide to common Schumann resonance symptoms searches, what people usually report, how to read those claims responsibly, and why live context matters before drawing conclusions.
Read More → Schumann Resonance Whiteout Meaning: What Bright White Spectrogram Zones Usually Show
Understand what Schumann resonance whiteout usually means on a spectrogram, when bright white zones can reflect strong activity, clipping, or monitoring limits, and how to verify them.
Read More → Why Is Schumann Resonance Rising? Drivers Behind Frequency and Amplitude Changes
A practical explanation of why Schumann resonance readings can look higher, brighter, or more active, including lightning, ionospheric conditions, geomagnetic context, and local noise.
Read More → 7.83 Hz Meaning: What the Base Schumann Resonance Actually Represents
A grounded explanation of what 7.83 Hz means in Schumann resonance monitoring, why it is called the base mode, and what it does not automatically prove.
Read More → Schumann Resonance Live Graph: How to Read the 24/7 Spectrogram
Learn how to read a Schumann resonance live graph, what bright bands and quiet zones mean, and how to separate real structure from ordinary spectrogram noise.
Read More → Schumann Resonance Today: Live Frequency, Latest Reading, and How to Read It
A clear daily guide to the current Schumann resonance view, what the latest live frequency and amplitude mean, and how to separate real context from overreaction.
Read More →Schumann Resonance March 2026 Report: Baseline Conditions, Drivers, and Interpretation Notes
A March 2026 monitoring brief focused on baseline behavior, short-lived amplitude lifts, and how to interpret them without exaggeration.
Read More →Schumann Resonance Symptoms: What Science Supports and What It Does Not
A careful review of symptom claims, evidence limits, and why live Schumann charts should never be used as diagnosis or treatment advice.
Read More →How to Read a Schumann Spectrogram: Frequency Bands, Amplitude, and Noise
A step-by-step reading model for spectrogram axes, color intensity, harmonics, and common noise artifacts.
Read More →How Is Schumann Resonance Measured? Stations, Sensors, and Noise Limits
An overview of how ELF monitoring stations collect Schumann data, why stations differ, and why local noise always matters.
Read More →Space Weather and Schumann Resonance: Solar, Lightning, and Geomagnetic Drivers
A practical overview of how solar activity, lightning, ionospheric conditions, and geomagnetic storms can influence what Schumann monitoring stations display.
Read More →History of Schumann Resonance: From Schumann's Theory to Modern Monitoring
A short scientific timeline covering Schumann's original theory, experimental confirmation, and the rise of modern digital monitoring stations.
Read More →Schumann Resonance Daily Tracking Guide: A Practical 5-Step Workflow
A repeatable routine for checking live Schumann charts without overreacting to single spikes or noisy frames.
Read More →What Is a Schumann Resonance Spike? Causes, False Alarms, and Verification
Spikes are usually amplitude events, not permanent frequency jumps. This guide shows how to test whether a sudden peak is meaningful or mostly noise.
Read More →What Is Schumann Resonance? 7.83 Hz, Harmonics, and How to Read the Data
A grounded explainer on what the 7.83 Hz fundamental mode means, what changes in live charts, and which claims should be treated cautiously.
Read More →20 high-intent topics that grow the global search footprint
This roadmap mixes already-published pages with next-priority search topics so the site keeps expanding around durable intent.
Today reading guide and latest live interpretation
Captures daily intent around today pages and latest readings.
Cluster · Today & Live Data Live nowFull live graph guide for the 24/7 spectrogram
Anchors continuous demand around graph reading intent.
Cluster · Graph & Spectrogram Reading Live now7.83 Hz meaning and the base resonance layer
Owns the core beginner query around 7.83 Hz.
Cluster · 7.83 Hz & Harmonics Live nowWhy Schumann resonance rises on active days
Targets the strongest spike-and-rise question users ask.
Cluster · Why It Rises Live nowWhiteout meaning and bright spectrogram zones
Explains one of the most repeated visual search terms.
Cluster · Graph & Spectrogram Reading Live nowSpike verification and false alarm checklist
Balances viral spike claims with a verification workflow.
Cluster · Graph & Spectrogram Reading Live nowHow Schumann resonance is measured in practice
Builds trust around stations, sensors, and measurement limits.
Cluster · Science, Measurement & Myths Live nowWhat Schumann resonance is and how harmonics fit
Supports the evergreen beginner definition path.
Cluster · 7.83 Hz & Harmonics Live nowSpace weather, lightning, and geomagnetic drivers
Covers the environmental drivers behind active periods.
Cluster · Why It Rises Live nowNASA myths and what can actually be verified
Intercepts myth-heavy search demand with source checking.
Cluster · Science, Measurement & MythsSleep-related searches and what science supports
Targets one of the largest symptom-driven query groups.
Cluster · Effects on Body & MindSymptoms claims versus evidence boundaries
Keeps health-related traffic anchored in evidence.
Cluster · Effects on Body & Mind Live nowDaily tracking workflow for repeat visitors
Helps convert single visits into repeat monitoring behavior.
Cluster · Today & Live Data Live nowHow to read a spectrogram without overreacting to noise
Adds depth to the chart-reading cluster.
Cluster · Graph & Spectrogram Reading Live nowMonthly baseline report and interpretation notes
Creates archive-style entry points for monthly search intent.
Cluster · Today & Live Data Next priorityTomsk vs global station comparison guide
Next best page for source-comparison queries.
Cluster · Science, Measurement & MythsLightning map versus spectrogram cross-check workflow
Turns peak days into a repeatable verification path.
Cluster · Why It RisesBeginner glossary for chart labels, colors, and white bands
Captures informational searches before they bounce.
Cluster · Graph & Spectrogram ReadingTinnitus, pressure, and body sensation claims review
Research-first page for sensitive symptom searches.
Cluster · Effects on Body & MindAnomaly archive by day, week, and month intent
Builds long-tail archive coverage around date-based searches.
Cluster · Today & Live Data