Schumann Resonance Today: Live Frequency, Latest Reading, and How to Read It
When people search for Schumann resonance today, they usually want one practical answer: what is the latest live reading, and does it actually matter? The most reliable way to answer that question is to read the live spectrogram, headline frequency, amplitude field, and source timestamp together instead of reacting to one isolated number.
Quick answer
Schumann resonance today is not a single mystical number that suddenly controls every interpretation. It is a rolling environmental snapshot of extremely low frequency activity observed through monitoring stations. The most useful question is not simply “is the frequency higher?” but “what does the full live panel show right now compared with the recent baseline?”
What the live dashboard shows
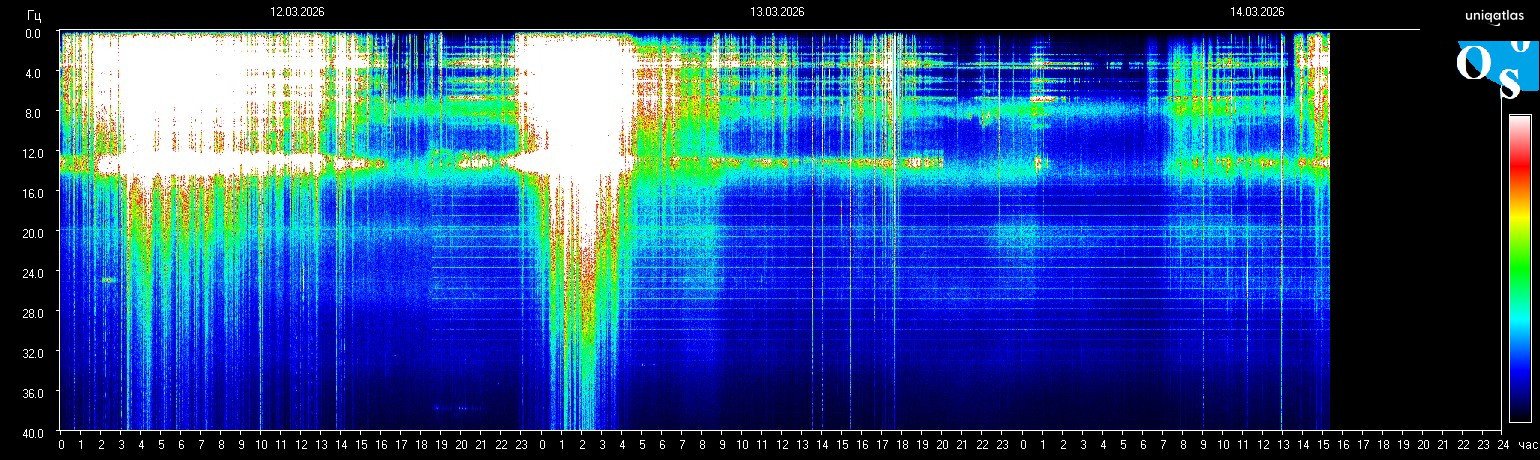
- Base frequency helps you see where the primary band is sitting around the familiar 7.83 Hz region.
- Amplitude tells you how strong the visible activity is inside the monitored window.
- Source time matters because an old frame can look dramatic even when the latest update has already calmed down.
- Spectrogram color and density show whether activity is narrow, broad, sustained, noisy, or saturated.
How to read today’s move without overreacting
- Start on the live home page and confirm the newest frame and timestamp.
- Open the today page to compare the current picture with the short-term context.
- Use the methodology page before treating a bright frame or sudden jump as proof of one dramatic cause.
Common mistakes
- Treating amplitude spikes as if the base frequency permanently changed.
- Ignoring source time and sharing an outdated image as if it were current.
- Reading a single panel without comparing the broader daily pattern.
Use the dashboard as environmental monitoring context. Avoid treating live Schumann charts as medical diagnosis, prophecy, or guaranteed proof of one explanation.
Best next step
If you want the latest frame first and the explanation second, keep the home page open, then use the today panel to judge whether the latest move is normal, elevated, or worth a closer look.
Stay inside the same topic cluster
Learn how to read charts, spikes, whiteouts, and spectrogram structure without mistaking noise for a real signal.
See the latest Schumann frame on the homepage
The homepage updates around the newest spectrogram frame, current frequency, and fast context. Open it first if you want the freshest signal before you keep reading.
Live frequency, latest frame, and short context update together.
Editorial Note
Schumann Resonance Live treats Schumann charts as environmental monitoring data, not medical diagnosis. For source limits and corrections, review Methodology and Editorial Standards.