Why Is Schumann Resonance Rising? Drivers Behind Frequency and Amplitude Changes
People ask why Schumann resonance is rising when live charts suddenly look brighter, denser, or more active than usual. The short answer is that the display can look “higher” for several reasons, and not all of them mean the same thing. Sometimes the visible change is more about amplitude, broader excitation, source conditions, or local station noise than a permanent jump in the base frequency.
Main drivers behind visible increases
- Global lightning activity can feed the Earth-ionosphere cavity and change what stations display.
- Ionospheric conditions can alter how energy propagates and how bands appear.
- Geomagnetic or space-weather context can influence the broader monitoring environment.
- Local noise or instrument behavior can make one frame look more dramatic than the wider pattern justifies.
Why “rising” is often the wrong shortcut
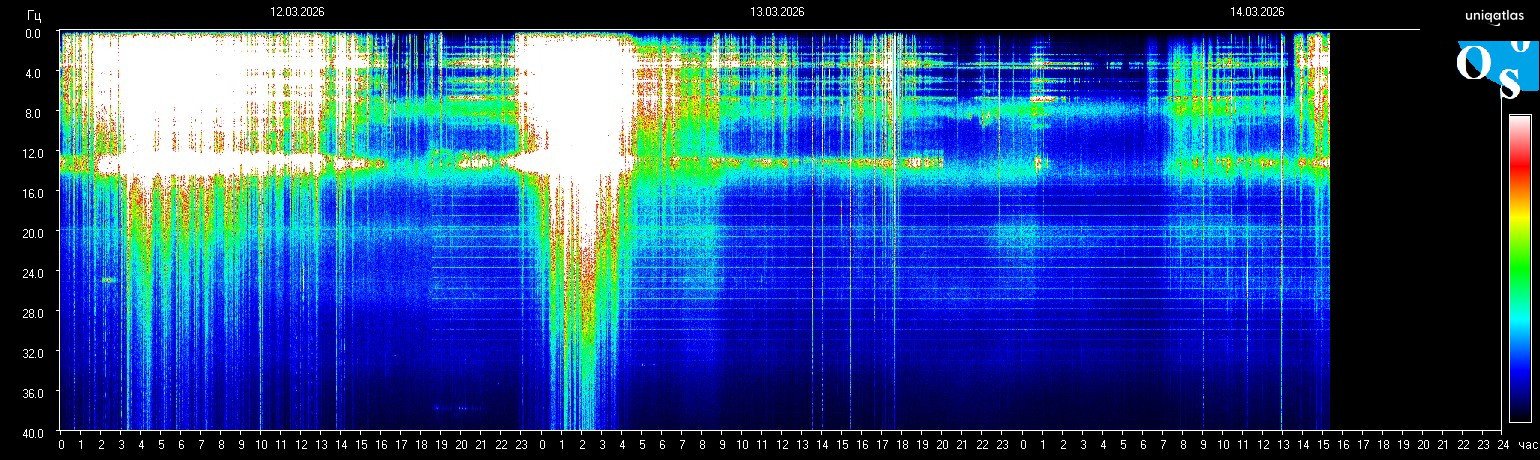
Many viral posts use the word rising as if one number is climbing in a straight line. In practice, live dashboards may be showing stronger amplitude, denser harmonics, brighter display saturation, or a temporary noisy interval. That is why a more careful reading asks what part of the display changed, not just whether the chart looks intense.
How to verify a real move
- Check the current live frame and source time.
- Compare it with the today panel so you can see whether the change is brief or sustained.
- Use the methodology notes before turning a bright image into a single-cause claim.
Better interpretation habits
Ask whether the base frequency moved, whether harmonics widened, whether amplitude simply became stronger, and whether the station timing is fresh. Those questions usually lead to a more accurate answer than a generic statement that “Schumann is exploding.”
“Rising” is best treated as a visual starting point, not a finished explanation. The chart needs timing, context, and comparison before it becomes a useful interpretation.
Best next step
If the latest frame looks unusually active, stay on the live homepage and compare it with the today context page before you describe the move as rare, extreme, or globally meaningful.
Stay inside the same topic cluster
Learn how to read charts, spikes, whiteouts, and spectrogram structure without mistaking noise for a real signal.
See the latest Schumann frame on the homepage
The homepage updates around the newest spectrogram frame, current frequency, and fast context. Open it first if you want the freshest signal before you keep reading.
Live frequency, latest frame, and short context update together.
Editorial Note
Schumann Resonance Live treats Schumann charts as environmental monitoring data, not medical diagnosis. For source limits and corrections, review Methodology and Editorial Standards.