Schumann Resonance Whiteout Meaning: What Bright White Spectrogram Zones Usually Show
A Schumann resonance whiteout is one of the most shared and misunderstood visuals on live monitoring pages. When a spectrogram suddenly turns bright white across part of the image, people often assume it proves an extraordinary event. Sometimes it does show very strong visible intensity, but it can also reflect saturation, clipping, scale limits, or one station-specific artifact that needs verification.
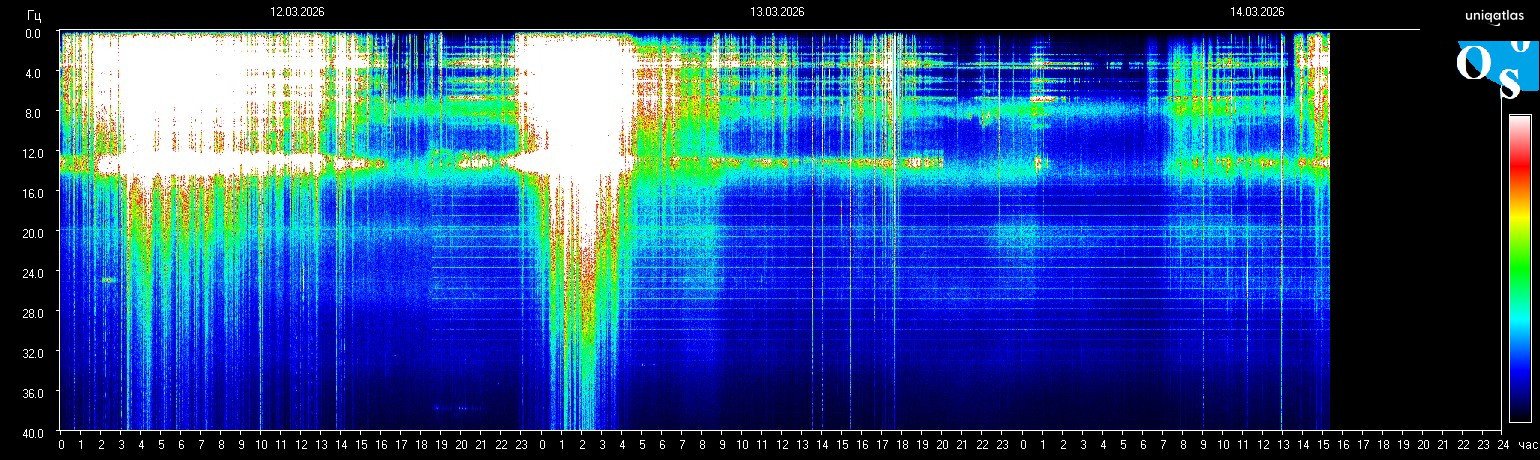
What “whiteout” usually means
On many spectrogram color scales, white is close to the highest visible intensity range. That means the display is showing a very bright or saturated section of the monitored frame. The important detail is that white alone does not tell you why the panel reached that point.
Possible explanations behind white zones
- Strong broad activity that genuinely pushes the display into a high-intensity band.
- Clipping or saturation where the visible range reaches the top of the scale.
- Local noise or interference that exaggerates what one station sees.
- Display or capture limitations that compress detail into one bright block.
How to verify a whiteout before sharing it
- Check the source time on the latest live frame.
- Compare the image with the today view to see whether the bright area is brief, repeated, or sustained.
- Read the methodology page before treating one white block as proof of a single spiritual or physical cause.
What a careful interpretation sounds like
A careful reader says: “The frame shows a bright saturated zone that may reflect strong intensity, clipping, or another station-specific condition; I need timing and comparison before I label it.” That is far more accurate than saying every whiteout is a rare global explosion.
Whiteout is a display clue, not a final conclusion. The meaning becomes stronger only after you compare source time, surrounding bands, daily context, and methodology limits.
Best next step
If you see a bright white block, keep the live homepage open for the newest update and use the today graph guide to read that frame with more discipline before sharing it.
Stay inside the same topic cluster
Learn how to read charts, spikes, whiteouts, and spectrogram structure without mistaking noise for a real signal.
See the latest Schumann frame on the homepage
The homepage updates around the newest spectrogram frame, current frequency, and fast context. Open it first if you want the freshest signal before you keep reading.
Live frequency, latest frame, and short context update together.
Editorial Note
Schumann Resonance Live treats Schumann charts as environmental monitoring data, not medical diagnosis. For source limits and corrections, review Methodology and Editorial Standards.