Schumann Resonance Live Graph: How to Read the 24/7 Spectrogram
The phrase Schumann resonance live graph usually refers to the scrolling spectrogram image that shows how activity is distributed across time, frequency, and intensity. It looks dramatic at first glance, but the best readers do not start with emotion. They start with structure.
What a live Schumann graph actually is
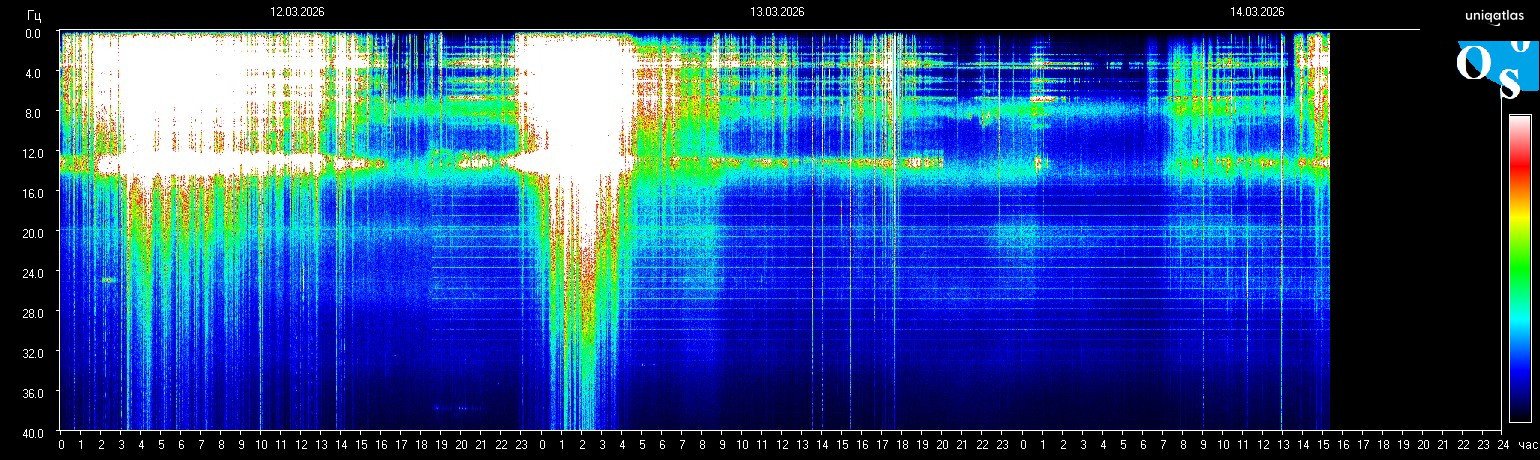
A live graph is not just a line. On most Schumann pages it is a spectrogram, which means time runs across the image, frequency bands appear vertically, and brightness or color density shows relative signal strength. That is why one frame can contain far more information than a single headline frequency number.
How to read the key parts
- Horizontal structure helps identify recurring bands and stable layers.
- Bright vertical bursts often reflect short energetic events, interference, or sudden amplitude expansion.
- Dark calm zones can simply mean quieter energy or lower visible activity in that window.
- White saturation can mean very strong display intensity, clipping, or a monitoring artifact that needs context.
A practical reading workflow
- Check the newest frame on the home page.
- Confirm the timestamp before you interpret what you see.
- Compare the graph with the today view so one bright block is not mistaken for an all-day condition.
- Use the methodology notes whenever you are unsure whether a pattern is likely environmental, instrumental, or just noisy.
What the graph does not tell you by itself
A spectrogram alone does not prove one spiritual claim, one medical outcome, or one global cause. It is a monitoring image. It becomes useful when you pair it with timing, base frequency, amplitude, source reliability, and the station context behind the frame.
The strongest habit is comparison: compare now vs earlier today, signal vs noise, and visible intensity vs actual source freshness before posting a dramatic interpretation.
Best next step
Use the live home page when you want the newest spectrogram first, then jump to the today page for short-term context if the latest frame looks unusually bright, compressed, or saturated.
Stay inside the same topic cluster
Learn how to read charts, spikes, whiteouts, and spectrogram structure without mistaking noise for a real signal.
See the latest Schumann frame on the homepage
The homepage updates around the newest spectrogram frame, current frequency, and fast context. Open it first if you want the freshest signal before you keep reading.
Live frequency, latest frame, and short context update together.
Editorial Note
Schumann Resonance Live treats Schumann charts as environmental monitoring data, not medical diagnosis. For source limits and corrections, review Methodology and Editorial Standards.