Schumann Resonance Symptoms: What People Report and What the Data Can Actually Support
The search term Schumann resonance symptoms keeps appearing because people want to connect how they feel with what the live chart is doing. That is understandable, but the careful answer is not “every symptom comes from one graph.” A better answer is to separate reported experiences from what the environmental data can actually support.
What people commonly report
- Sleep disruption, vivid dreams, or waking up at unusual hours.
- Head pressure, fatigue, or a restless feeling during intense days.
- Emotional sensitivity, especially when people are already stressed or overstimulated.
- Focus changes, including feeling unusually clear or unusually distracted.
What the live data can and cannot do
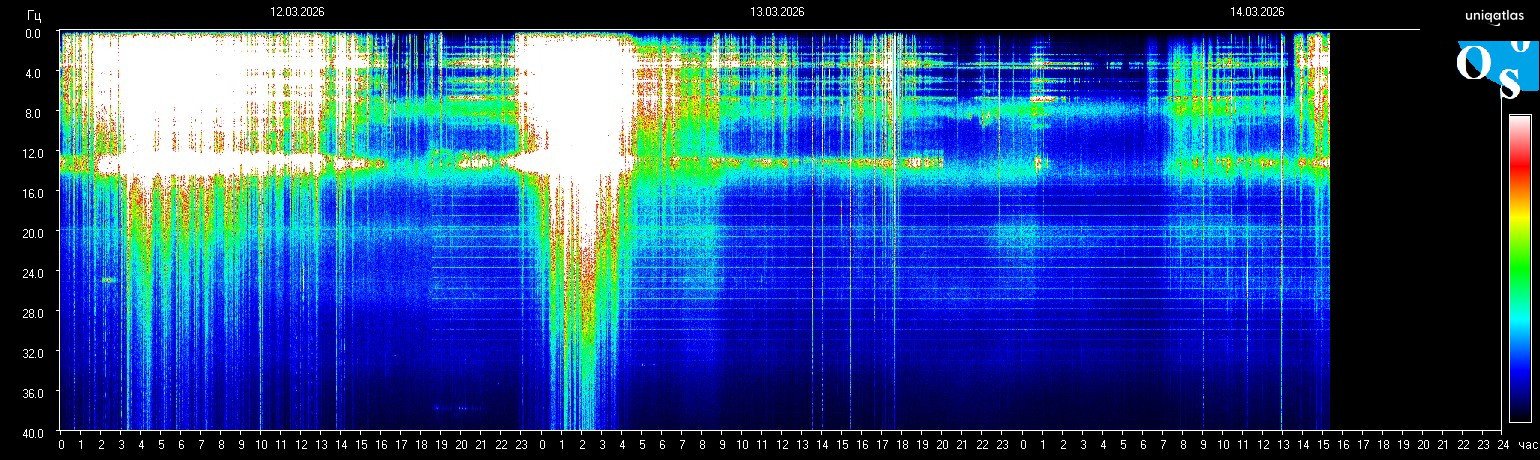
Live Schumann data can show that the monitored environment looks calm, active, noisy, compressed, or unusually bright. What it cannot do by itself is diagnose a health issue or prove that one physical sensation was caused by one specific chart. That is why the strongest articles keep the chart in its lane: environmental monitoring, not medical certainty.
How to read symptoms claims more responsibly
- Open the live homepage and verify the newest frame and timestamp.
- Compare the short-term picture on the today page instead of reacting to one screenshot.
- Use the methodology page before turning one active image into a universal explanation.
Why context matters
Many things can overlap with the same day someone checks a Schumann chart: poor sleep, stress load, dehydration, weather shifts, caffeine, illness, or ordinary life pressure. A careful reader does not deny subjective experience. They simply avoid pretending the chart proves more than it can.
What a balanced interpretation sounds like
A balanced interpretation sounds like this: “I noticed certain symptoms, and the live environmental panel also looked active. That may be interesting context, but it is not enough to prove a direct cause.” That sentence is more reliable than a dramatic claim that every uncomfortable day is a Schumann event.
Use Schumann resonance as context, not diagnosis. If symptoms are severe, persistent, or medical in nature, a chart is not a substitute for proper health evaluation.
Best next step
If you want to compare how you feel with the latest monitoring view, keep the home page open for the newest frame, then use the today page and FAQ to stay grounded in what the panel can realistically tell you.
Stay inside the same topic cluster
Learn how to read charts, spikes, whiteouts, and spectrogram structure without mistaking noise for a real signal.
See the latest Schumann frame on the homepage
The homepage updates around the newest spectrogram frame, current frequency, and fast context. Open it first if you want the freshest signal before you keep reading.
Live frequency, latest frame, and short context update together.
Editorial Note
Schumann Resonance Live treats Schumann charts as environmental monitoring data, not medical diagnosis. For source limits and corrections, review Methodology and Editorial Standards.