Schumann Resonance Chart Colors Meaning: How to Read Blue, Green, Yellow, Red, and White
The query Schumann resonance chart colors meaning is popular because many readers react first to color, not numbers. A chart looks calm, bright, alarming, or dramatic before they have read one label. That makes color useful, but also risky. To read it well, you need to know both what the palette usually suggests and what it can hide.
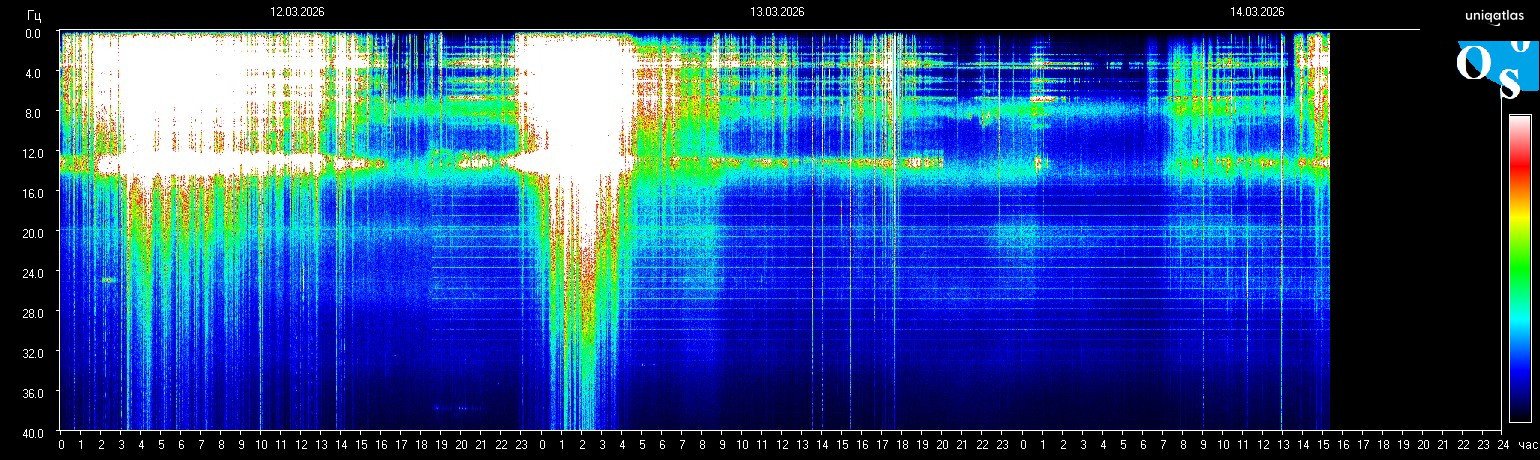
What the colors usually imply
- Blue or darker zones often reflect lower visible intensity or quieter sections of the frame.
- Green and yellow areas often point to moderate visible activity or stronger bands becoming more pronounced.
- Red zones often signal stronger intensity inside the displayed range.
- White zones usually indicate the top end of the visible scale, which can mean very strong intensity, clipping, or saturation.
Why one station’s palette is not universal law
Not every monitoring page uses identical scaling, contrast, or palette mapping. One station may show moderate intensity with colors that look dramatic, while another may compress the same energy differently. That is why the strongest interpretation starts with “what does this station’s palette appear to mean?” rather than assuming one universal legend fits every chart on the internet.
How to avoid color-only mistakes
- Check the newest frame on the live homepage.
- Compare color with the actual band position, not with color alone.
- Use the today page to see whether the bright block is brief or sustained.
- Read the methodology page before treating one white or red zone as proof of one extraordinary cause.
What careful readers look for
Careful readers look for frequency placement, width of the bright area, source time, neighboring bands, and whether the image looks clipped. They do not stop at “it turned white, so the meaning is obvious.”
Why white deserves extra caution
White is often where the chart becomes most shareable and most misread. Sometimes it is a strong event. Sometimes it is simply the top of the display range. That is why white should increase verification, not certainty.
Color is a reading aid, not the whole interpretation. The stronger the color, the more important timing, station behavior, and context become.
Best next step
If the latest chart looks unusually colorful, compare the frame on the live home page with the today graph guide before you describe a blue, red, or white block as a final conclusion.
Stay inside the same topic cluster
Learn how to read charts, spikes, whiteouts, and spectrogram structure without mistaking noise for a real signal.
See the latest Schumann frame on the homepage
The homepage updates around the newest spectrogram frame, current frequency, and fast context. Open it first if you want the freshest signal before you keep reading.
Live frequency, latest frame, and short context update together.
Editorial Note
Schumann Resonance Live treats Schumann charts as environmental monitoring data, not medical diagnosis. For source limits and corrections, review Methodology and Editorial Standards.