SYMPTOMS HUB
Schumann Resonance symptoms, meaning, and live context
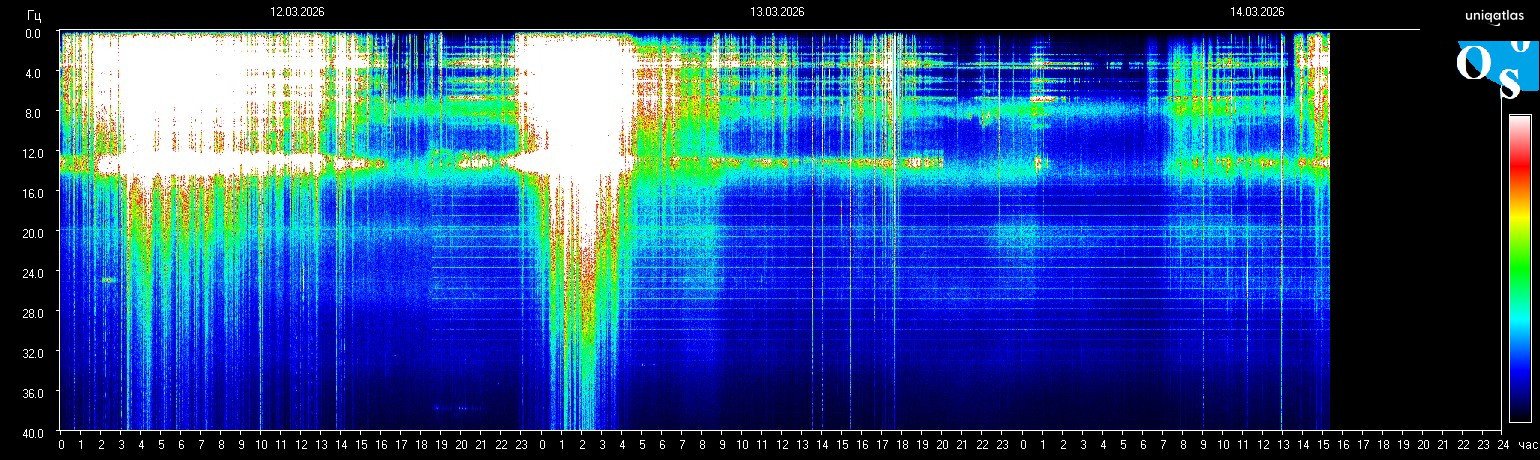
Many people search for Schumann Resonance symptoms when the chart looks active. The safest way to read those searches is to compare them with live signal quality, archive continuity, and wider context before drawing conclusions.
The current base frequency helps anchor interpretation before emotional meaning is added.
Cleaner signal quality makes personal interpretation less likely to overfit noise.
Stable patterns deserve more attention than isolated bright frames.
Why people search Schumann Resonance symptoms
Searches usually rise when the chart looks bright, unusual, or widely shared. People often describe tiredness, vivid dreams, emotional intensity, or pressure changes, but these reports are personal and not a medical diagnosis.
Safer ways to interpret symptoms-related searches
- Check whether the live frame is actually strong or simply noisy
- Compare the current frame with archived windows from 24 and 48 hours ago
- Use space weather and source context before giving a strong meaning to one image
- Treat community reports as subjective notes, not scientific proof
What the chart can and cannot tell you
A chart can show pressure, spread, continuity, and relative brightness. It cannot confirm that a physical or emotional feeling was caused by the resonance itself. The most reliable reading comes from comparing live data, archive frames, and source quality together.
Symptoms FAQ
Are Schumann Resonance symptoms medically proven?
No. Searches and community stories exist, but they are not a medical diagnosis or proof of causation. They should be treated as personal reports.
Why do symptoms searches spike when the chart brightens?
A bright chart draws attention, so people look for explanations. That does not automatically mean the chart is the cause of what they feel.
What is the best page to check before interpreting symptoms?
Start with the live monitor, compare recent archive frames, and then review the space weather context before forming a stronger conclusion.
This page discusses community-reported interpretations and should not be treated as medical advice.