グラフとスペクトログラムの読み方
Learn how to read charts, spikes, whiteouts, and spectrogram structure without mistaking noise for a real signal.
Search-intent clusters built for live discovery
You are inside the グラフとスペクトログラムの読み方 cluster. Every article below reinforces the same search intent and internal link path.
今日とライブデータ
Track latest readings, live monitor pages, daily updates, and fresh spectrogram frames in one cluster.
Open cluster 14 articlesグラフとスペクトログラムの読み方
Learn how to read charts, spikes, whiteouts, and spectrogram structure without mistaking noise for a real signal.
Current cluster 0 articles7.83Hzと高調波
Focus on the base band, harmonic levels, and what people usually mean when they search 7.83 Hz.
Open cluster 0 articlesなぜ上がるのか
Group the drivers behind rising frequency and amplitude, including lightning, ionosphere shifts, geomagnetic context, and space weather.
Open cluster 0 articles心身への影響
Collect evidence-based pages around sleep, headaches, anxiety, meditation, and other body-mind claims people search most.
Open cluster 1 articles科学・測定・誤解
Keep source checking, NASA myths, station limits, and measurement methodology in a verification-first cluster.
Open cluster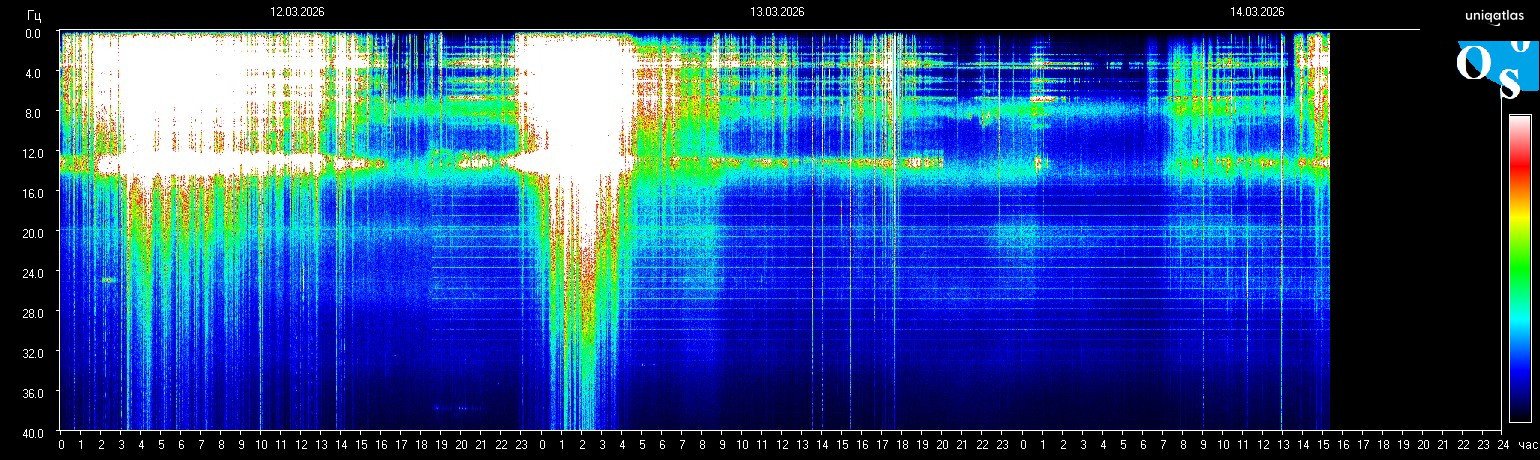
シューマン共振のホワイトアウトの意味: 明るい白いスペクトログラム領域が通常示すもの
シューマン共振のホワイトアウトが通常何を意味するのか、白い領域が強い活動、クリッピング、観測上の限界を示し得る場面、そしてその確認方法を解説します。
続きを読む → なぜシューマン共振は上昇して見えるのか? 周波数と振幅変化の要因
シューマン共振の表示が高く、明るく、活発に見える理由を、雷、電離圏条件、地磁気環境、局所ノイズを含めて実務的に解説します。
続きを読む → 7.83Hzの意味: 基本シューマン共振が実際に示すもの
シューマン観測における7.83Hzの意味、なぜ基本モードと呼ばれるのか、そしてそれだけでは自動的に何を証明しないのかを整理した解説です。
続きを読む → シューマン共振ライブグラフ: 24時間スペクトログラムの読み方
シューマン共振のライブグラフの読み方、明るい帯や静かな領域の意味、そして実際の構造と通常のスペクトログラムノイズを見分ける方法を解説します。
続きを読む → 今日のシューマン共振: ライブ周波数、最新読み取り、その見方
現在のシューマン共振の見え方、ライブ周波数と振幅の意味、そして本当の文脈と過剰反応をどう分けるかを整理した日次ガイドです。
続きを読む →シューマン共振 2026年3月レポート: ベースライン、要因、解釈メモ
ベースラインの挙動、短時間の振幅上昇、それらを誇張せずに解釈する方法に焦点を当てた 2026年3月の観測メモです。
続きを読む →シューマン共振の症状: 科学が支持することと支持しないこと
症状に関する主張、エビデンスの限界、そしてライブのシューマンチャートを診断や治療助言として使うべきではない理由を慎重に整理したレビューです。
続きを読む →シューマンスペクトログラムの読み方: 周波数帯、振幅、ノイズ
スペクトログラムの軸、色の強さ、倍音、代表的なノイズアーティファクトを段階的に読むためのモデルです。
続きを読む →シューマン共振はどう測定されるのか? 観測局、センサー、ノイズの限界
ELF 観測局がシューマンデータをどのように収集するか、観測局ごとの差、そして局所ノイズが常に重要である理由をまとめた概要です。
続きを読む →宇宙天気とシューマン共振: 太陽活動、雷、地磁気の要因
太陽活動、雷、電離圏の状態、地磁気嵐がシューマン観測局の表示にどう影響し得るかを実務的に整理した概要です。
続きを読む →シューマン共振の歴史: シューマン理論から現代の観測まで
シューマンの初期理論、実験的な確認、そして現代のデジタル観測局の発展までを追う短い科学年表です。
続きを読む →シューマン共振の毎日トラッキングガイド: 実践的な5ステップ
単発のスパイクやノイズの多いフレームに過剰反応せず、ライブのシューマンチャートを確認するための再現しやすい手順です。
続きを読む →シューマン共振のスパイクとは何か? 原因、誤報、検証
スパイクは多くの場合、恒久的な周波数変化ではなく振幅イベントです。このガイドでは、急なピークが意味のある現象か単なるノイズかを見分ける方法を説明します。
続きを読む →シューマン共振とは何か? 7.83Hz、倍音、データの読み方
7.83Hz の基本モードの意味、ライブチャートで何が変わるのか、どの主張に注意が必要かを整理した解説です。
続きを読む →20 high-intent topics that grow the global search footprint
This roadmap mixes already-published pages with next-priority search topics so the site keeps expanding around durable intent.
Today reading guide and latest live interpretation
Captures daily intent around today pages and latest readings.
Cluster · 今日とライブデータ Live nowFull live graph guide for the 24/7 spectrogram
Anchors continuous demand around graph reading intent.
Cluster · グラフとスペクトログラムの読み方 Live now7.83 Hz meaning and the base resonance layer
Owns the core beginner query around 7.83 Hz.
Cluster · 7.83Hzと高調波 Live nowWhy Schumann resonance rises on active days
Targets the strongest spike-and-rise question users ask.
Cluster · なぜ上がるのか Live nowWhiteout meaning and bright spectrogram zones
Explains one of the most repeated visual search terms.
Cluster · グラフとスペクトログラムの読み方 Live nowSpike verification and false alarm checklist
Balances viral spike claims with a verification workflow.
Cluster · グラフとスペクトログラムの読み方 Live nowHow Schumann resonance is measured in practice
Builds trust around stations, sensors, and measurement limits.
Cluster · 科学・測定・誤解 Live nowWhat Schumann resonance is and how harmonics fit
Supports the evergreen beginner definition path.
Cluster · 7.83Hzと高調波 Live nowSpace weather, lightning, and geomagnetic drivers
Covers the environmental drivers behind active periods.
Cluster · なぜ上がるのか Live nowNASA myths and what can actually be verified
Intercepts myth-heavy search demand with source checking.
Cluster · 科学・測定・誤解 Next prioritySleep-related searches and what science supports
Targets one of the largest symptom-driven query groups.
Cluster · 心身への影響 Live nowSymptoms claims versus evidence boundaries
Keeps health-related traffic anchored in evidence.
Cluster · 心身への影響 Live nowDaily tracking workflow for repeat visitors
Helps convert single visits into repeat monitoring behavior.
Cluster · 今日とライブデータ Live nowHow to read a spectrogram without overreacting to noise
Adds depth to the chart-reading cluster.
Cluster · グラフとスペクトログラムの読み方 Live nowMonthly baseline report and interpretation notes
Creates archive-style entry points for monthly search intent.
Cluster · 今日とライブデータ Next priorityTomsk vs global station comparison guide
Next best page for source-comparison queries.
Cluster · 科学・測定・誤解 Next priorityLightning map versus spectrogram cross-check workflow
Turns peak days into a repeatable verification path.
Cluster · なぜ上がるのか Next priorityBeginner glossary for chart labels, colors, and white bands
Captures informational searches before they bounce.
Cluster · グラフとスペクトログラムの読み方 In researchTinnitus, pressure, and body sensation claims review
Research-first page for sensitive symptom searches.
Cluster · 心身への影響 In researchAnomaly archive by day, week, and month intent
Builds long-tail archive coverage around date-based searches.
Cluster · 今日とライブデータ