Is Schumann Resonance Dangerous? What Live Data Can and Cannot Tell You
Nota sulla lingua
Questa pagina resta in Italiano per navigazione e SEO. Qui sotto mostriamo un breve riepilogo locale mentre la versione editoriale completa in questa lingua viene ancora ampliata.
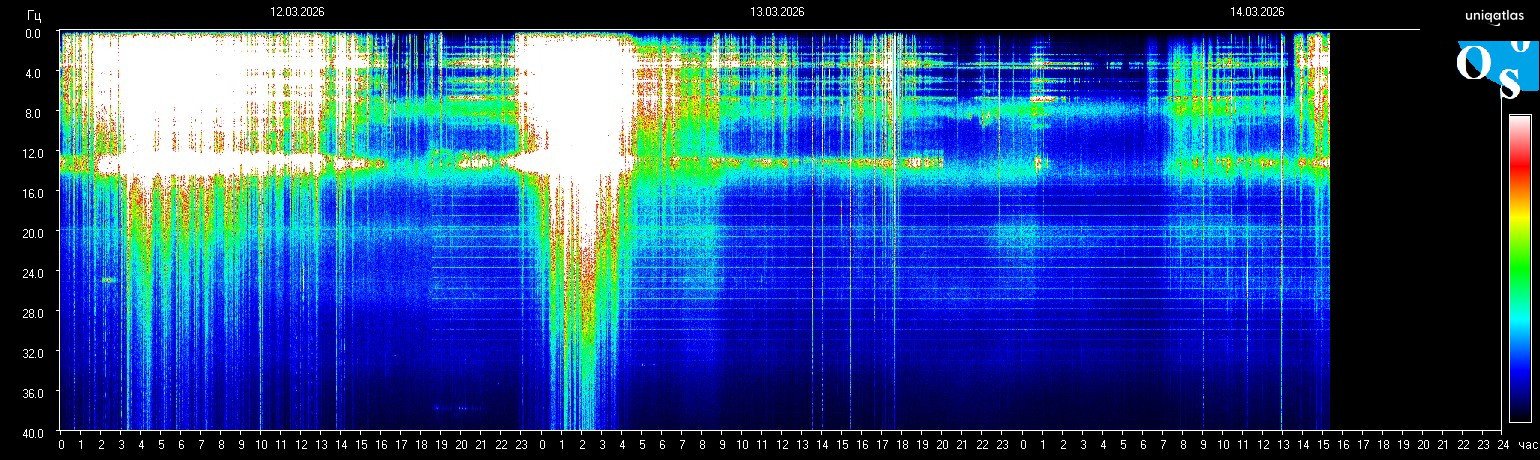
Is Schumann resonance dangerous? is a high-emotion search, which is exactly why it needs careful language. Live charts can show calm conditions, brighter intensity, compression, or unusual-looking frames. They cannot by themselves diagnose harm or confirm a personal health outcome.
What the live data can tell you
- Whether the visible frame looks quiet, active, compressed, or bright.
- Whether the pattern is brief or sustained across the day.
- Whether the latest available frame is fresh or delayed.
What the live data cannot tell you alone
- That one chart directly caused a symptom.
- That a brighter frame equals verified harm.
- That one screenshot is enough to replace broader context or expert evaluation.
Best next step
Use the live homepage and today page as environmental context. If you are trying to answer a health or safety question, do not treat a chart as a medical conclusion.
Stay inside the same topic cluster
Learn how to read charts, spikes, whiteouts, and spectrogram structure without mistaking noise for a real signal.
Apri in home il frame Schumann più recente
La home si aggiorna attorno allo spettrogramma più recente, alla frequenza attuale e al contesto rapido. Aprila prima se vuoi vedere il segnale più fresco prima di continuare a leggere.
Frequenza live, ultimo frame e contesto breve insieme.
Nota editoriale
Schumann Resonance Live considera i grafici Schumann come dati di monitoraggio ambientale, non come diagnosi medica. Per limiti delle fonti e correzioni, consulta Metodologia e Standard editoriali.