What Can Raise Schumann Resonance Charts? Storms, Noise, Compression, and Station Limits
言語メモ
このページはナビゲーションと SEO のために 日本語 表示を維持します。現在この言語の完全な編集版を拡張中のため、下には簡潔なローカル要約を表示しています。
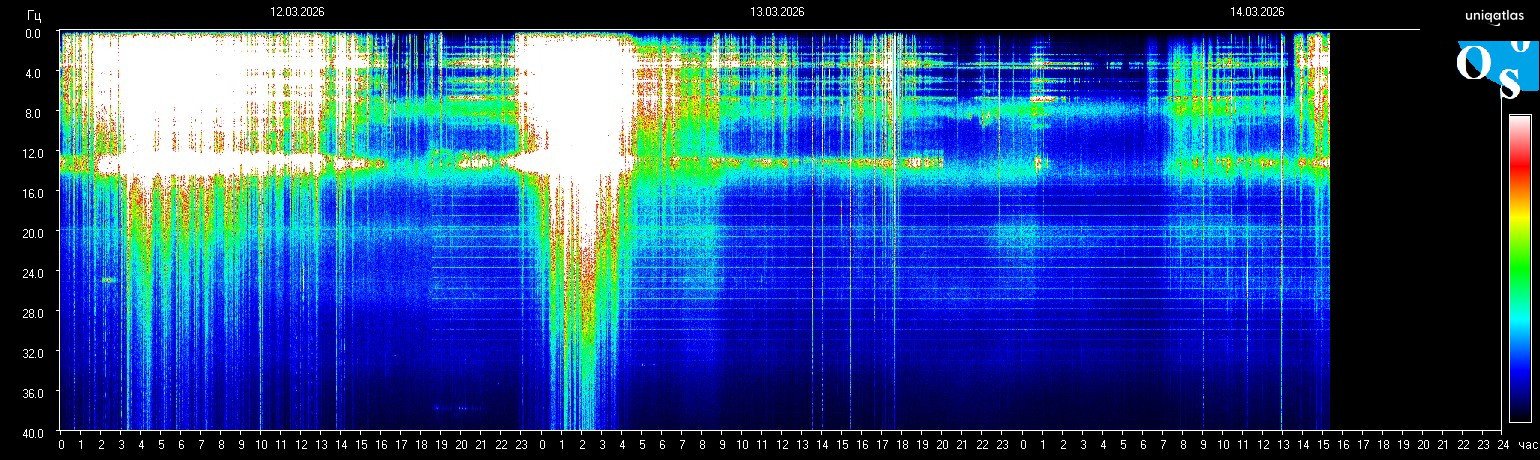
Readers often ask what can raise a Schumann chart because a bright panel looks like it should have one simple cause. In practice, there can be more than one driver. Some relate to the monitored environment, while others come from station behavior or image presentation.
Main categories to check
- Environmental pressure that appears across the monitored bands.
- Noise and interference that add irregular lines or local artifacts.
- Compression and display limits that make one section look more dramatic than it really is.
- Station-specific scaling that changes how intensity is visualized.
Why one cause is rarely enough
A chart can look stronger because several factors overlap. That is why the best reading avoids one-cause certainty and starts with “what combination of signal, noise, scale, and timing could explain this frame?”
Best next step
Use the live homepage for the freshest frame, compare it with the today context, and keep the methodology page open while interpreting unusually bright movement.
Stay inside the same topic cluster
Learn how to read charts, spikes, whiteouts, and spectrogram structure without mistaking noise for a real signal.
最新のシューマンフレームをホームで開く
ホームページでは最新スペクトログラム、現在の周波数、短い文脈が継続的に更新されます。続きを読む前に一番新しいシグナルを見たいなら、まずここを開いてください。
ライブ周波数、最新フレーム、短い文脈をまとめて確認できます。
編集メモ
Schumann Resonance Live はシューマンチャートを医療診断ではなく環境モニタリングデータとして扱います。情報源の限界や訂正方針については、方法論 と 編集基準 を確認してください。