What Can Raise Schumann Resonance Charts? Storms, Noise, Compression, and Station Limits
Nota sulla lingua
Questa pagina resta in Italiano per navigazione e SEO. Qui sotto mostriamo un breve riepilogo locale mentre la versione editoriale completa in questa lingua viene ancora ampliata.
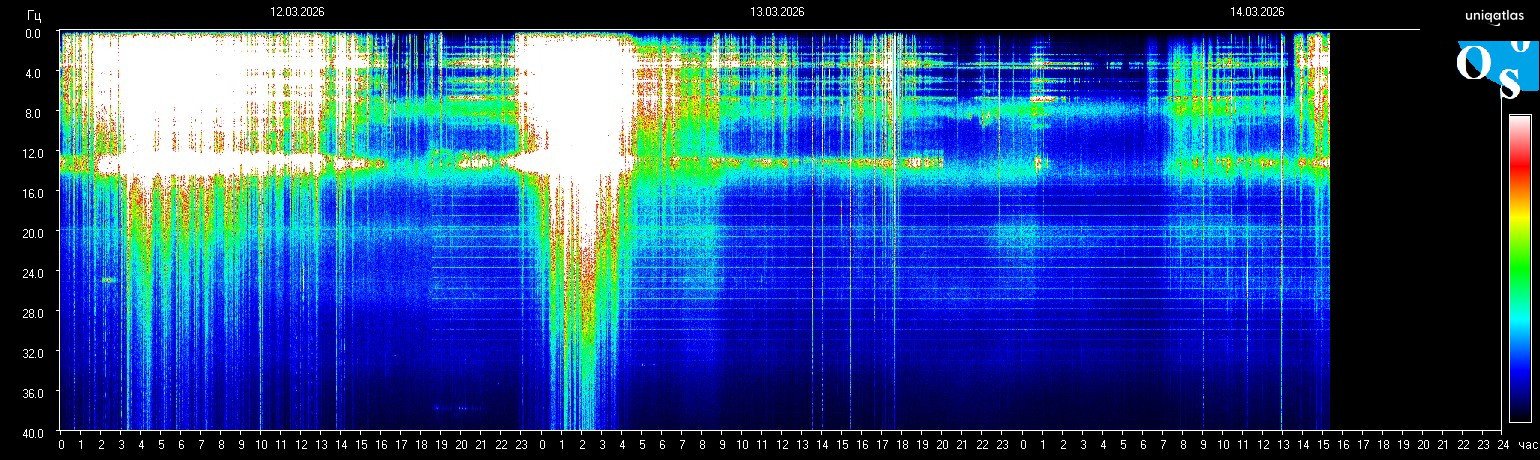
Readers often ask what can raise a Schumann chart because a bright panel looks like it should have one simple cause. In practice, there can be more than one driver. Some relate to the monitored environment, while others come from station behavior or image presentation.
Main categories to check
- Environmental pressure that appears across the monitored bands.
- Noise and interference that add irregular lines or local artifacts.
- Compression and display limits that make one section look more dramatic than it really is.
- Station-specific scaling that changes how intensity is visualized.
Why one cause is rarely enough
A chart can look stronger because several factors overlap. That is why the best reading avoids one-cause certainty and starts with “what combination of signal, noise, scale, and timing could explain this frame?”
Best next step
Use the live homepage for the freshest frame, compare it with the today context, and keep the methodology page open while interpreting unusually bright movement.
Stay inside the same topic cluster
Learn how to read charts, spikes, whiteouts, and spectrogram structure without mistaking noise for a real signal.
Apri in home il frame Schumann più recente
La home si aggiorna attorno allo spettrogramma più recente, alla frequenza attuale e al contesto rapido. Aprila prima se vuoi vedere il segnale più fresco prima di continuare a leggere.
Frequenza live, ultimo frame e contesto breve insieme.
Nota editoriale
Schumann Resonance Live considera i grafici Schumann come dati di monitoraggio ambientale, non come diagnosi medica. Per limiti delle fonti e correzioni, consulta Metodologia e Standard editoriali.