What Can Raise Schumann Resonance Charts? Storms, Noise, Compression, and Station Limits
Note de langue
Cette page reste en Français pour la navigation et le SEO. Un résumé local concis est affiché ci-dessous pendant que la version éditoriale complète dans cette langue est encore en cours d’extension.
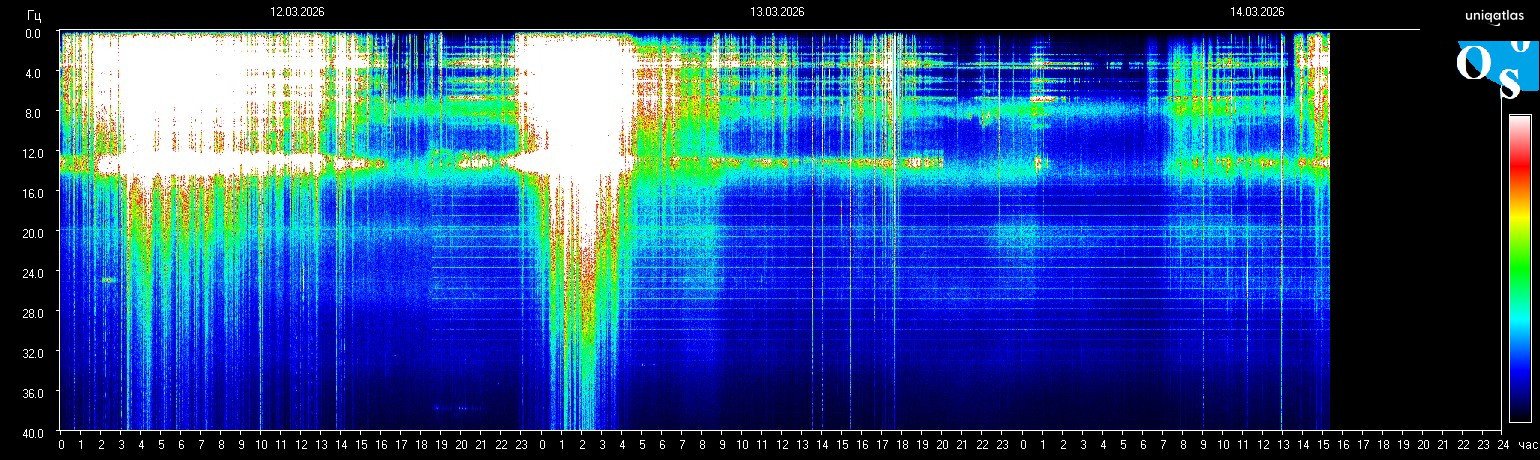
Readers often ask what can raise a Schumann chart because a bright panel looks like it should have one simple cause. In practice, there can be more than one driver. Some relate to the monitored environment, while others come from station behavior or image presentation.
Main categories to check
- Environmental pressure that appears across the monitored bands.
- Noise and interference that add irregular lines or local artifacts.
- Compression and display limits that make one section look more dramatic than it really is.
- Station-specific scaling that changes how intensity is visualized.
Why one cause is rarely enough
A chart can look stronger because several factors overlap. That is why the best reading avoids one-cause certainty and starts with “what combination of signal, noise, scale, and timing could explain this frame?”
Best next step
Use the live homepage for the freshest frame, compare it with the today context, and keep the methodology page open while interpreting unusually bright movement.
Stay inside the same topic cluster
Learn how to read charts, spikes, whiteouts, and spectrogram structure without mistaking noise for a real signal.
Ouvrez le dernier cadre Schumann sur la page d’accueil
La page d’accueil se met à jour autour du spectrogramme le plus récent, de la fréquence actuelle et du contexte rapide. Ouvrez-la d’abord si vous voulez le signal le plus frais avant de poursuivre.
Fréquence live, dernier cadre et contexte court au même endroit.
Note éditoriale
Schumann Resonance Live traite les graphiques Schumann comme des données de surveillance environnementale, et non comme un diagnostic médical. Pour les limites des sources et les corrections, consultez Méthodologie et Standards éditoriaux.