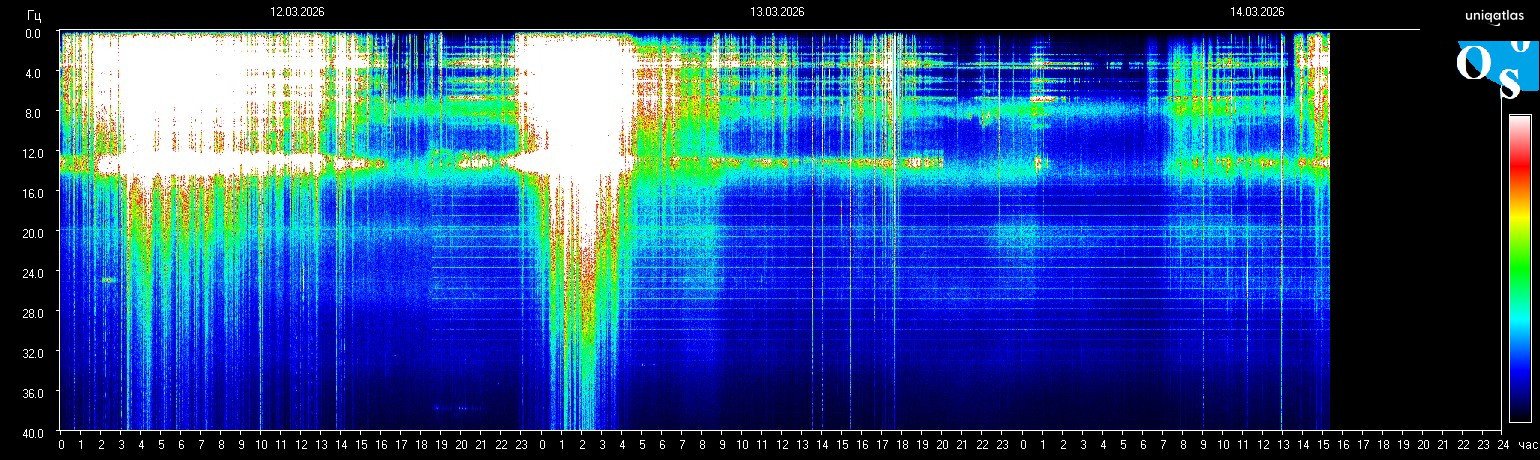
What Can Raise Schumann Resonance Charts? Storms, Noise, Compression, and Station Limits
ملاحظة اللغة
تبقى هذه الصفحة باللغة العربية لأغراض التصفح وSEO. ويظهر أدناه ملخص محلي موجز بينما يجري توسيع النسخة التحريرية الكاملة بهذه اللغة.
Readers often ask what can raise a Schumann chart because a bright panel looks like it should have one simple cause. In practice, there can be more than one driver. Some relate to the monitored environment, while others come from station behavior or image presentation.
Main categories to check
- Environmental pressure that appears across the monitored bands.
- Noise and interference that add irregular lines or local artifacts.
- Compression and display limits that make one section look more dramatic than it really is.
- Station-specific scaling that changes how intensity is visualized.
Why one cause is rarely enough
A chart can look stronger because several factors overlap. That is why the best reading avoids one-cause certainty and starts with “what combination of signal, noise, scale, and timing could explain this frame?”
Best next step
Use the live homepage for the freshest frame, compare it with the today context, and keep the methodology page open while interpreting unusually bright movement.
Stay inside the same topic cluster
Learn how to read charts, spikes, whiteouts, and spectrogram structure without mistaking noise for a real signal.
افتح أحدث لقطة لشومان من الصفحة الرئيسية
تتجدد الصفحة الرئيسية حول أحدث طيف وصورة تردد حالية وسياق سريع. افتحها أولًا إذا كنت تريد أحدث إشارة قبل متابعة القراءة.
التردد المباشر وآخر لقطة والسياق السريع في مكان واحد.
ملاحظة تحريرية
تتعامل Schumann Resonance Live مع مخططات شومان بوصفها بيانات رصد بيئي وليست تشخيصًا طبيًا. ولمعرفة حدود المصادر والتصحيحات راجع المنهجية والمعايير التحريرية.